Number theory: Understanding the Union Budget’s tax calculations

A higher tax buoyancy than 2022-23 is among the most crucial assumptions in the 2023-24 Budget. Tax buoyancy measures changes in taxes per unit change in GDP. Here are four charts that explain why this assumption is critical, and provide a wider context to the Budget’s tax calculations.
Gross Tax Revenue growth would be much lower if tax buoyancy for 2023-24 was at 2022-23 levels
Implied tax buoyancy for 2022-23, as per the first advanced estimates of GDP for 2022-23 and the Gross Tax Revenue (GTR) in the Revised Estimate (RE) for 2022-23 comes to 0.8. This means that taxes have grown at a slower pace compared to GDP growth. If the same tax buoyancy was to hold for 2023-24 – the Budget’s assumption is 0.99 – GTR would grow from Rs. 30.4 lakh crore in 2022-23 (RE) to Rs.33 lakh crore in 2023-24. This is 1.8% less than Budget Estimate (BE) number for 2023-24.
Also read | Decoding the big numbers in Union Budget 2023-24
It is interesting to note that tax buoyancy for 2022-23, as per the RE GTR numbers and first advanced estimates for GDP, has also ended up marginally lower than what the 2022-23 Budget had assumed it to be (0.86). Had tax buoyancy remained at the level that was assumed in the 2022-23 Budget, GTR number for 2022-23 should have been 0.78% more than what the 2022-23 RE number is. To be sure, because nominal GDP for 2022-23 has ended up higher than what last year’s budget assumed, RE numbers for GTR are 10% higher than the BE numbers.
How does the 2023-24 Budget arrive at a higher tax buoyancy number?
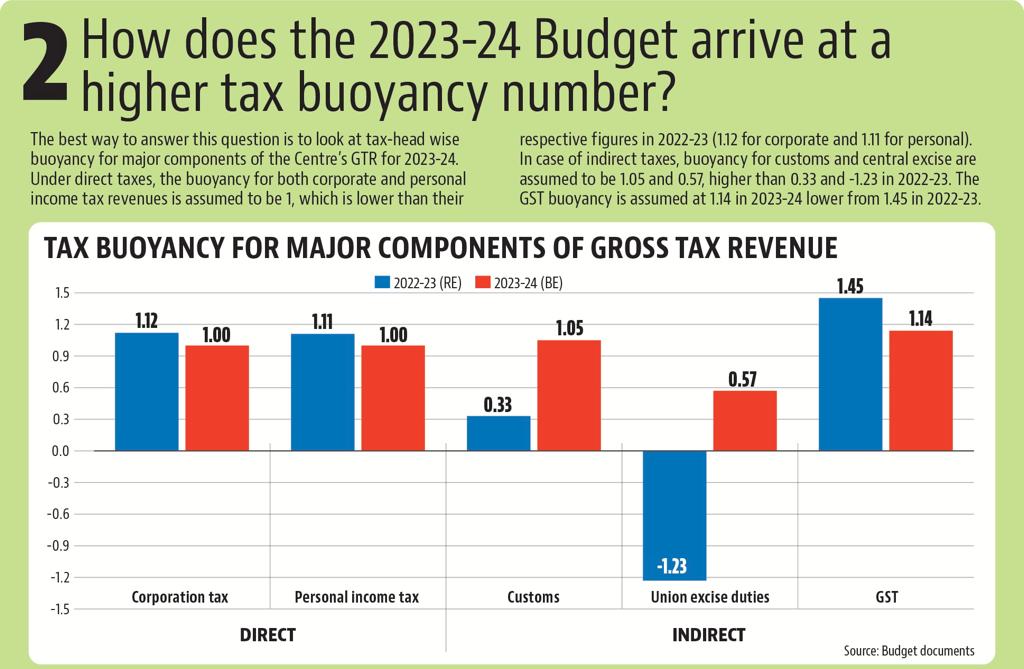
The best way to answer this question is to look at tax-head wise buoyancy for major components of the Centre’s GTR for 2023-24. Under direct taxes, the buoyancy for both corporate and personal income tax revenues is assumed to be 1, which is lower than their respective figures in 2022-23 (1.12 for corporate and 1.11 for personal). In case of indirect taxes, buoyancy for customs and central excise are assumed to be 1.05 and 0.57, higher than 0.33 and -1.23 in 2022-23. The GST buoyancy is assumed at 1.14 in 2023-24 lower from 1.45 in 2022-23.

Is the Budget’s tax buoyancy estimate off the mark?
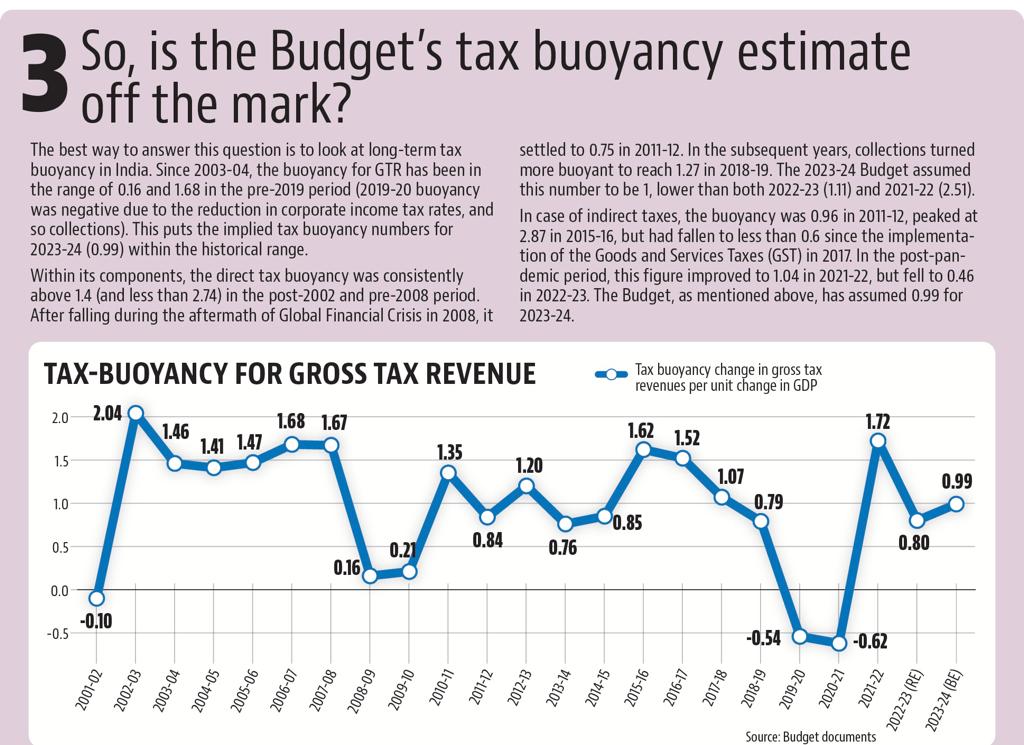
The best way to answer this question is to look at long-term tax buoyancy in India. Since 2003-04, the buoyancy for gross tax revenues has been in the range of 0.16 and 1.68 in the pre-2019 period (2019-20 buoyancy was negative due to the reduction in corporate income tax rates, and so collections). This puts the implied tax buoyancy numbers for 2023-24 (0.99) within the historical range.
Within its components, the direct tax buoyancy was consistently above 1.4 (and less than 2.74) in the post-2002 and pre-2008 period. After falling during the aftermath of Global Financial Crisis in 2008, it settled to 0.75 in 2011-12. In the subsequent years, collections turned more buoyant to reach 1.27 in 2018-19. The 2023-24 Budget assumed this number to be 1, lower than both 2022-23 (1.11) and 2021-22 (2.51).
In case of indirect taxes, the buoyancy was 0.96 in 2011-12, peaked at 2.87 in 2015-16, but had fallen to less than 0.6 since the implementation of the Goods and Services Taxes (GST) in 2017. In the post-pandemic period, this figure improved to 1.04 in 2021-22, but fell to 0.46 in 2022-23. The Budget, as mentioned above, has assumed 0.99 for 2023-24.

Are taxes on petroleum products still doing the heavy lifting for revenue?
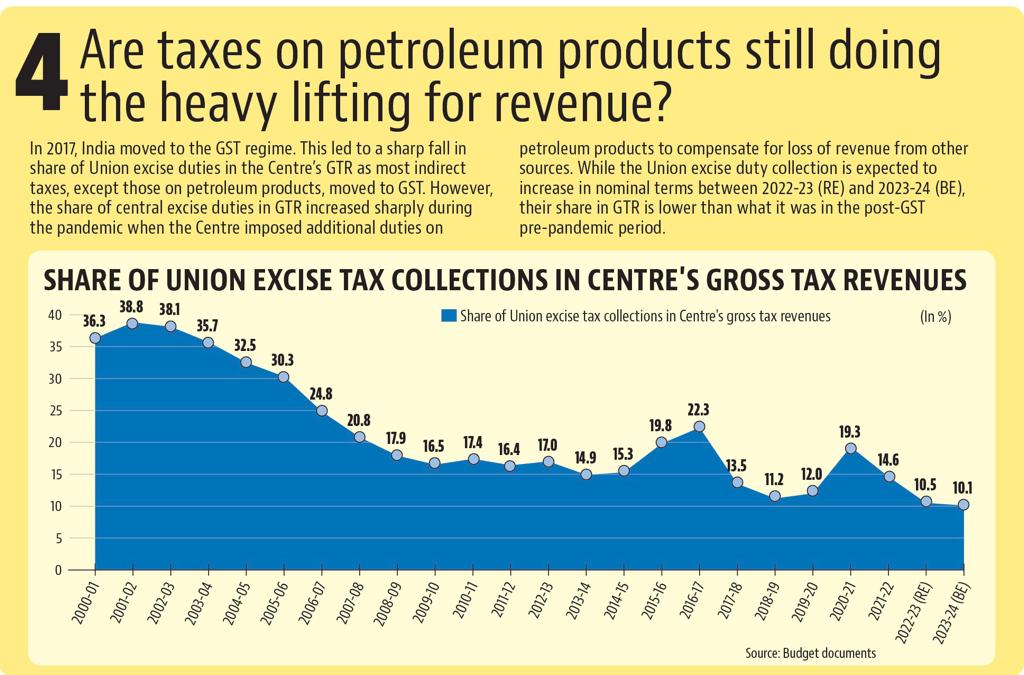
In 2017, India moved to the GST regime. This led to a sharp fall in share of union excise duties in the Centre’s GTR as most indirect taxes, except those on petroleum products, moved to GST. However, the share of central excise duties in GTR increased sharply during the pandemic when the Centre imposed additional duties on petroleum products to compensate for loss of revenue from other sources. While the union excise duty collection is expected to increase in nominal terms between 2022-23 (RE) and 2023-24 (BE), their share in GTR is lower than what it was in the post-GST pre-pandemic period.


Atul Tiwari is a seasoned journalist at Mumbai Times, specializing in city news, culture, and human-interest stories. With a knack for uncovering compelling narratives, Atul brings Mumbai’s vibrant spirit to life through his writing.


